
Voters 15
-
-
-
-
-
-
-
- + 9 voters
-
-
-
-
-
-
G
-
-


15
Ability to choose additional Granularities on charts when using CDR
- Live
 |
Isidora Radisic |
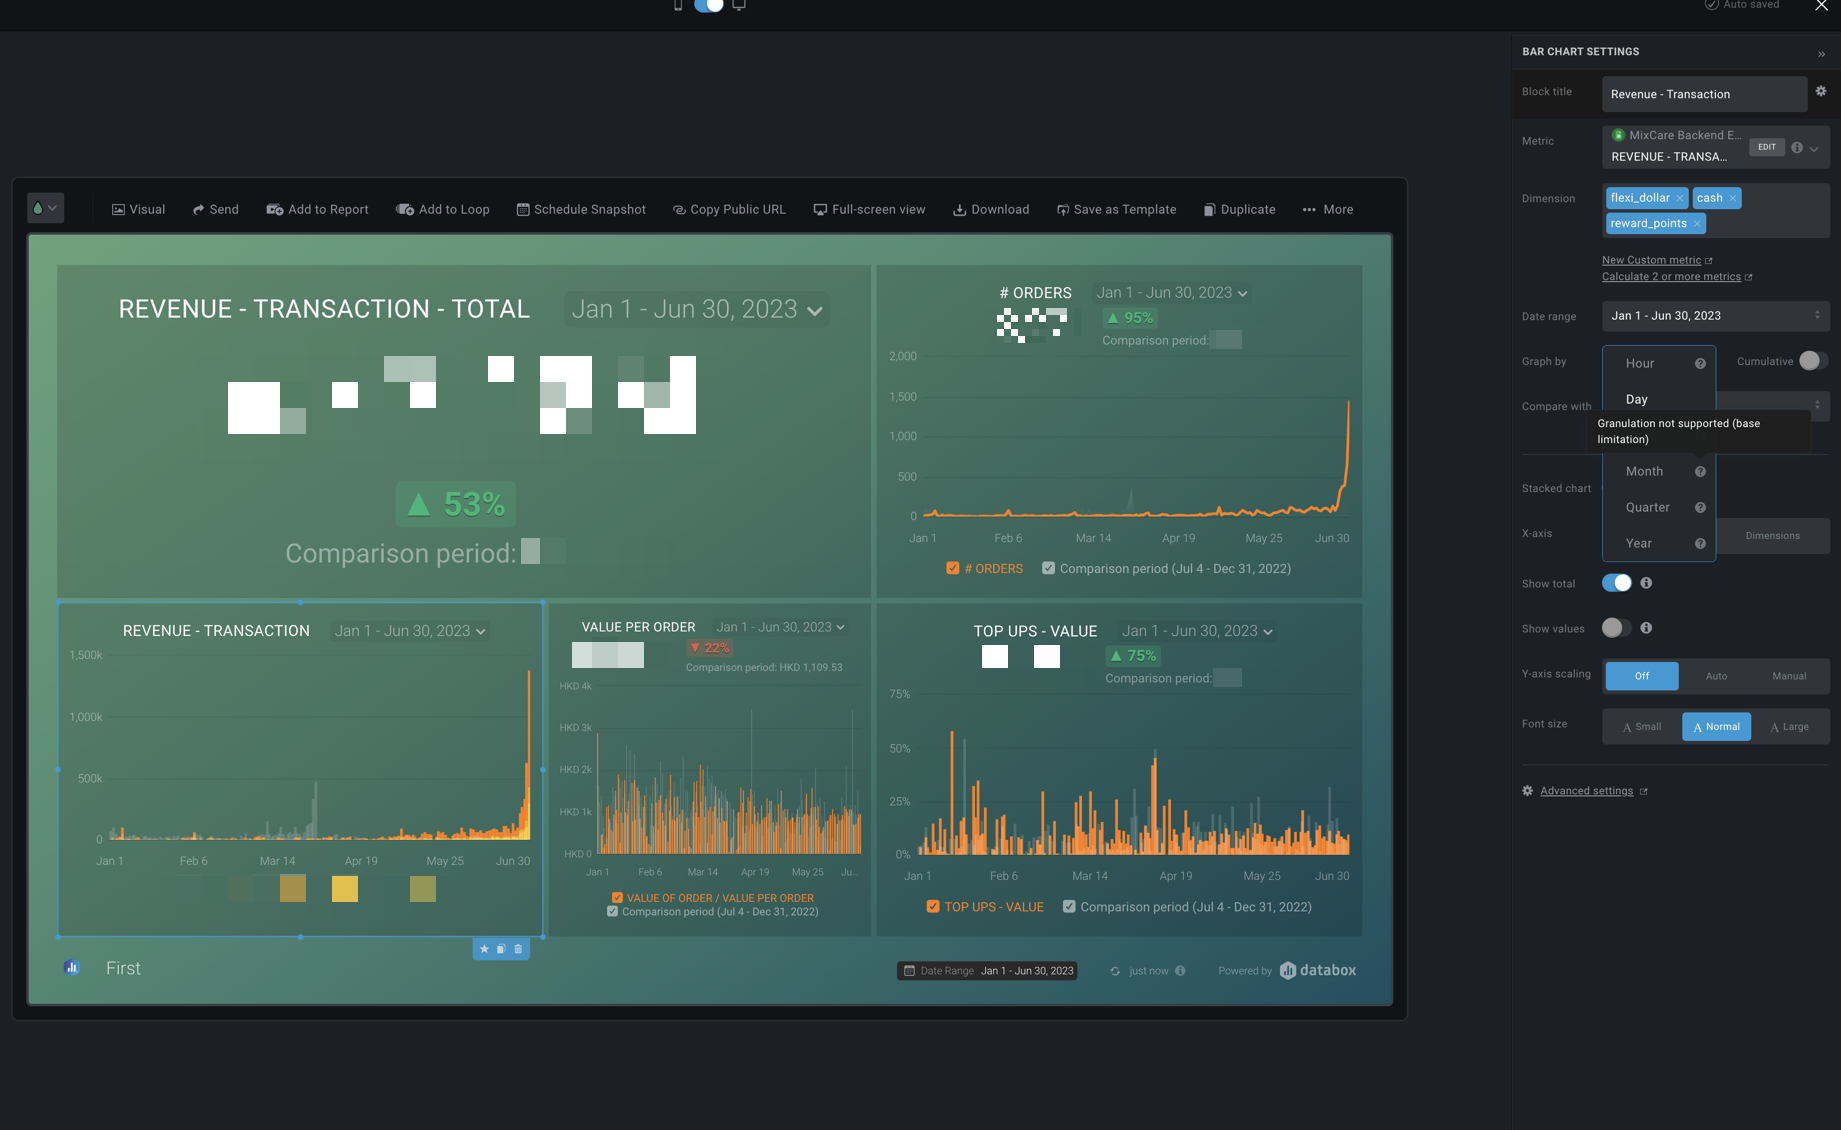
Currently, if Custom Date Range (with or without 'Rolling range' option) is selected, only Daily Granularity is available, even if the Date Range selected is for longer periods where Monthly / Weekly / Quarterly / Yearly Granularity could be applied.
All Granularities are available when "Last X Days/Weeks/Months/Quarters/Years" as a Date Range is selected, but if a specific start and end date is selected, they are not available.
Activity Newest / Oldest
Katja Pozeb
Status changed to: Live
Kasper Dam
We have clients that wish to see charts monthly and weekly while looking at custom date ranges. But instead, the charts keep reverting to daily when CDR is used.
Katja Pozeb
Merged with: More granularity support for custom date ranges
Katja Pozeb
Status changed to: In progress
Kasper Dam
This is quite an unhelpful limitation. I really hope this can be fixed.
Anthony Emeka Nwankwo
User wants to be able to choose additional granularity on charts when using CDR
Use case:
User want's flexibility when selecting certain Date Ranges as their sales seasons run from December till May and from June till November. So it is important for them to create graphs using this feature where they can show progress during a Sales season.
Owais Qureshi
User would like to set Granularity on a chart when a Custom Date Range is selected.
Milos Vukotic
Customer would like to be able to set Granularity on a chart by Month when a Custom Date Range is selected.
Sandra
Merged with: Graph by Month when Custom Date Range selected
Milos Vukotic
The customer would like to be able to set different granularity for charts, other than just ''by Day'', when a Custom Date Range is selected (for example, ''by Week'').
Sandra
Merged with: Graph custom date range by week
Sandra
Merged with: Allow CDR's to Graph by Month
Rusty Shores
Currently, if we use a Custom Date Range, we are only allowed to see graph by days.
However, much of our data (particularly in Google Sheets) is by months, so it would be nice to see graph data by months while using CDRs.
This would be especially helpful for those on a Fiscal Year set.
I assume it is currently not supported because there is a concern for showing the totals for partial months.
However, since the Custom Date Range will be displayed, it will be clear to those viewing the graph that those monthly totals (if the dates indicate partial months) will be partial totals.
Sandra
Post moved to this board