
Back
Web app update
- New
- Shafaq Zaidi
- on 2024/04/08

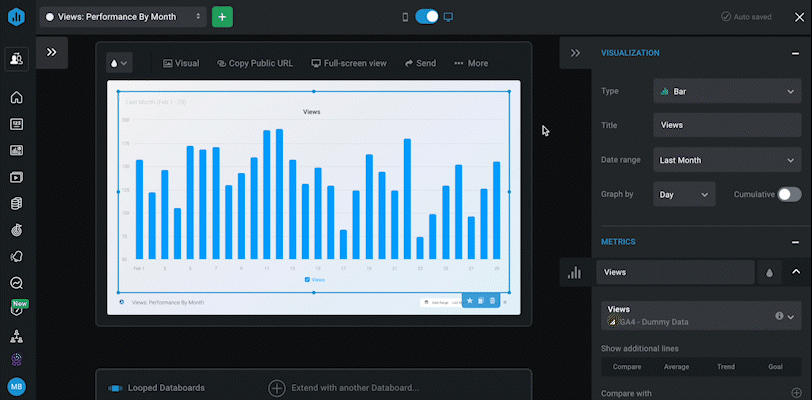
New in Databox: Benchmarks Line On Chart
Charts are great for visualizing trends and patterns, but without a reference point, it’s hard to know what “good” or “bad” performance looks like.
Now, users can add benchmark data directly onto their dashboard, to see how they’re performing compared to other companies. By including a benchmark line in a bar or line chart, users will be able to:
- Compare performance against standard benchmarks, custom cohorts, or similar businesses.
- Easily spot areas for improvement and make more informed decisions.
- Track goals alongside benchmark lines to see if your efforts are moving you in the right direction.
- Quickly see if you’re exceeding, meeting, or falling short of market tendencies.
Benchmarks are available on Growth and Premium plans. Starter and Professional plan users can request a trial by clicking:
Want to learn more?
Explore our detailed guide: How do I add Benchmarks to my Databoards.