
Back
Web app update
- New
- Shafaq Zaidi
- on 2024/04/22

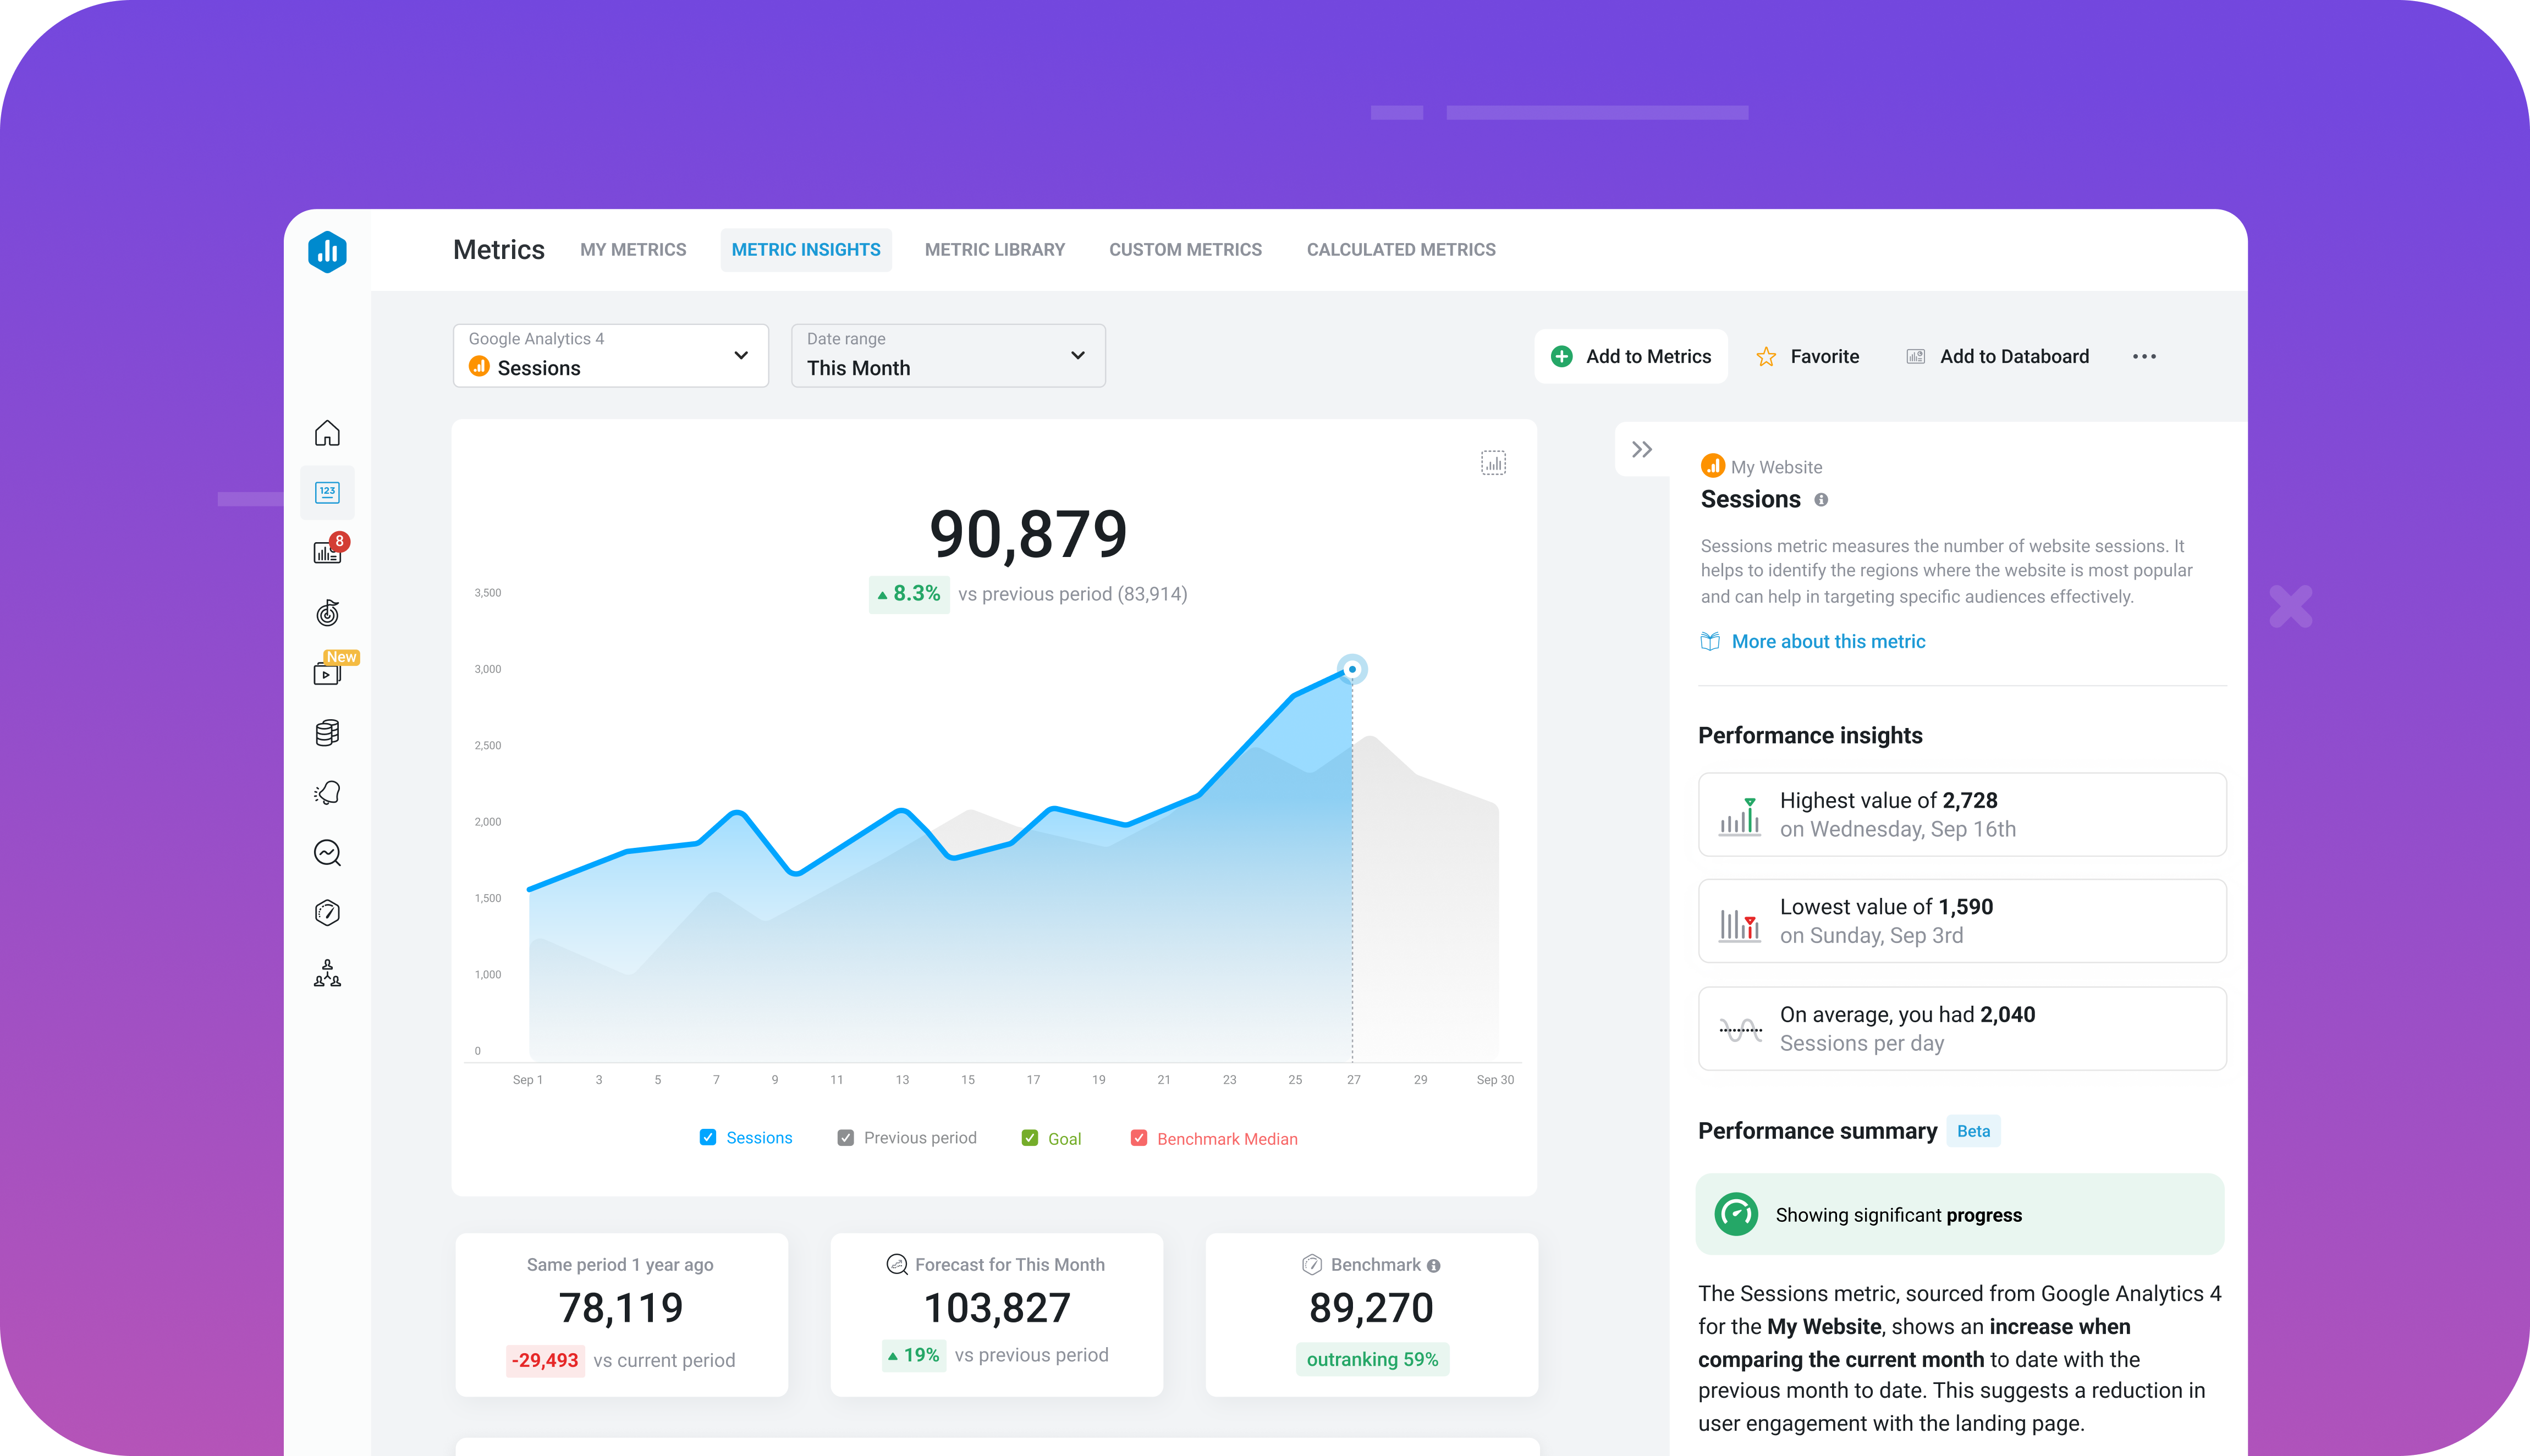
New in Databox: Metric Insights
No matter your role, you’re probably keeping a close eye on a handful of metrics. While you can track them on dashboards or receive notifications about their performance, sometimes you need to take a closer look at a specific metric to help you improve it.
With the new Metric Insights screen, users can now access the information about a specific metric from one place:
- Visualization: View your metric’s performance over time and easily switch between different chart types.
- Goals: Track all goals associated with that metric and monitor your progress toward achieving them.
- Metric Comparison: Compare your metric’s current performance to a specific time in the past.
- Metric Description: View a brief description of your metric to help you better interpret your results.
- Performance Summaries: Read updates on your metric’s performance, so you always know how it’s performing.
- Benchmarks: Compare your metric’s performance against other companies, so you know if you’re ahead of the curve or have room to improve.
- Forecasts: See how that metric is likely to perform in the future so you can make more informed decisions and craft better plans.
The Metric Insights screen is available on all plans. However, features like Forecasts and Performance Summaries are exclusively available to users on Growth and Premium plans.
Want to learn more?
Check out our blog for all the details.